DICOM ECG Viewer
Displaying electrocardiography data
The ECG viewer is used to display and analyze electrocardiogram (ECG) data in DICOM format obtained from different modalities, such as resting ECGs, ambulatory ECGs, and stress tests.
The viewer can also provide tools for measuring ECG intervals and amplitudes in various formats, such as 12-lead ECGs, 3-lead ECGs, and rhythm strips.
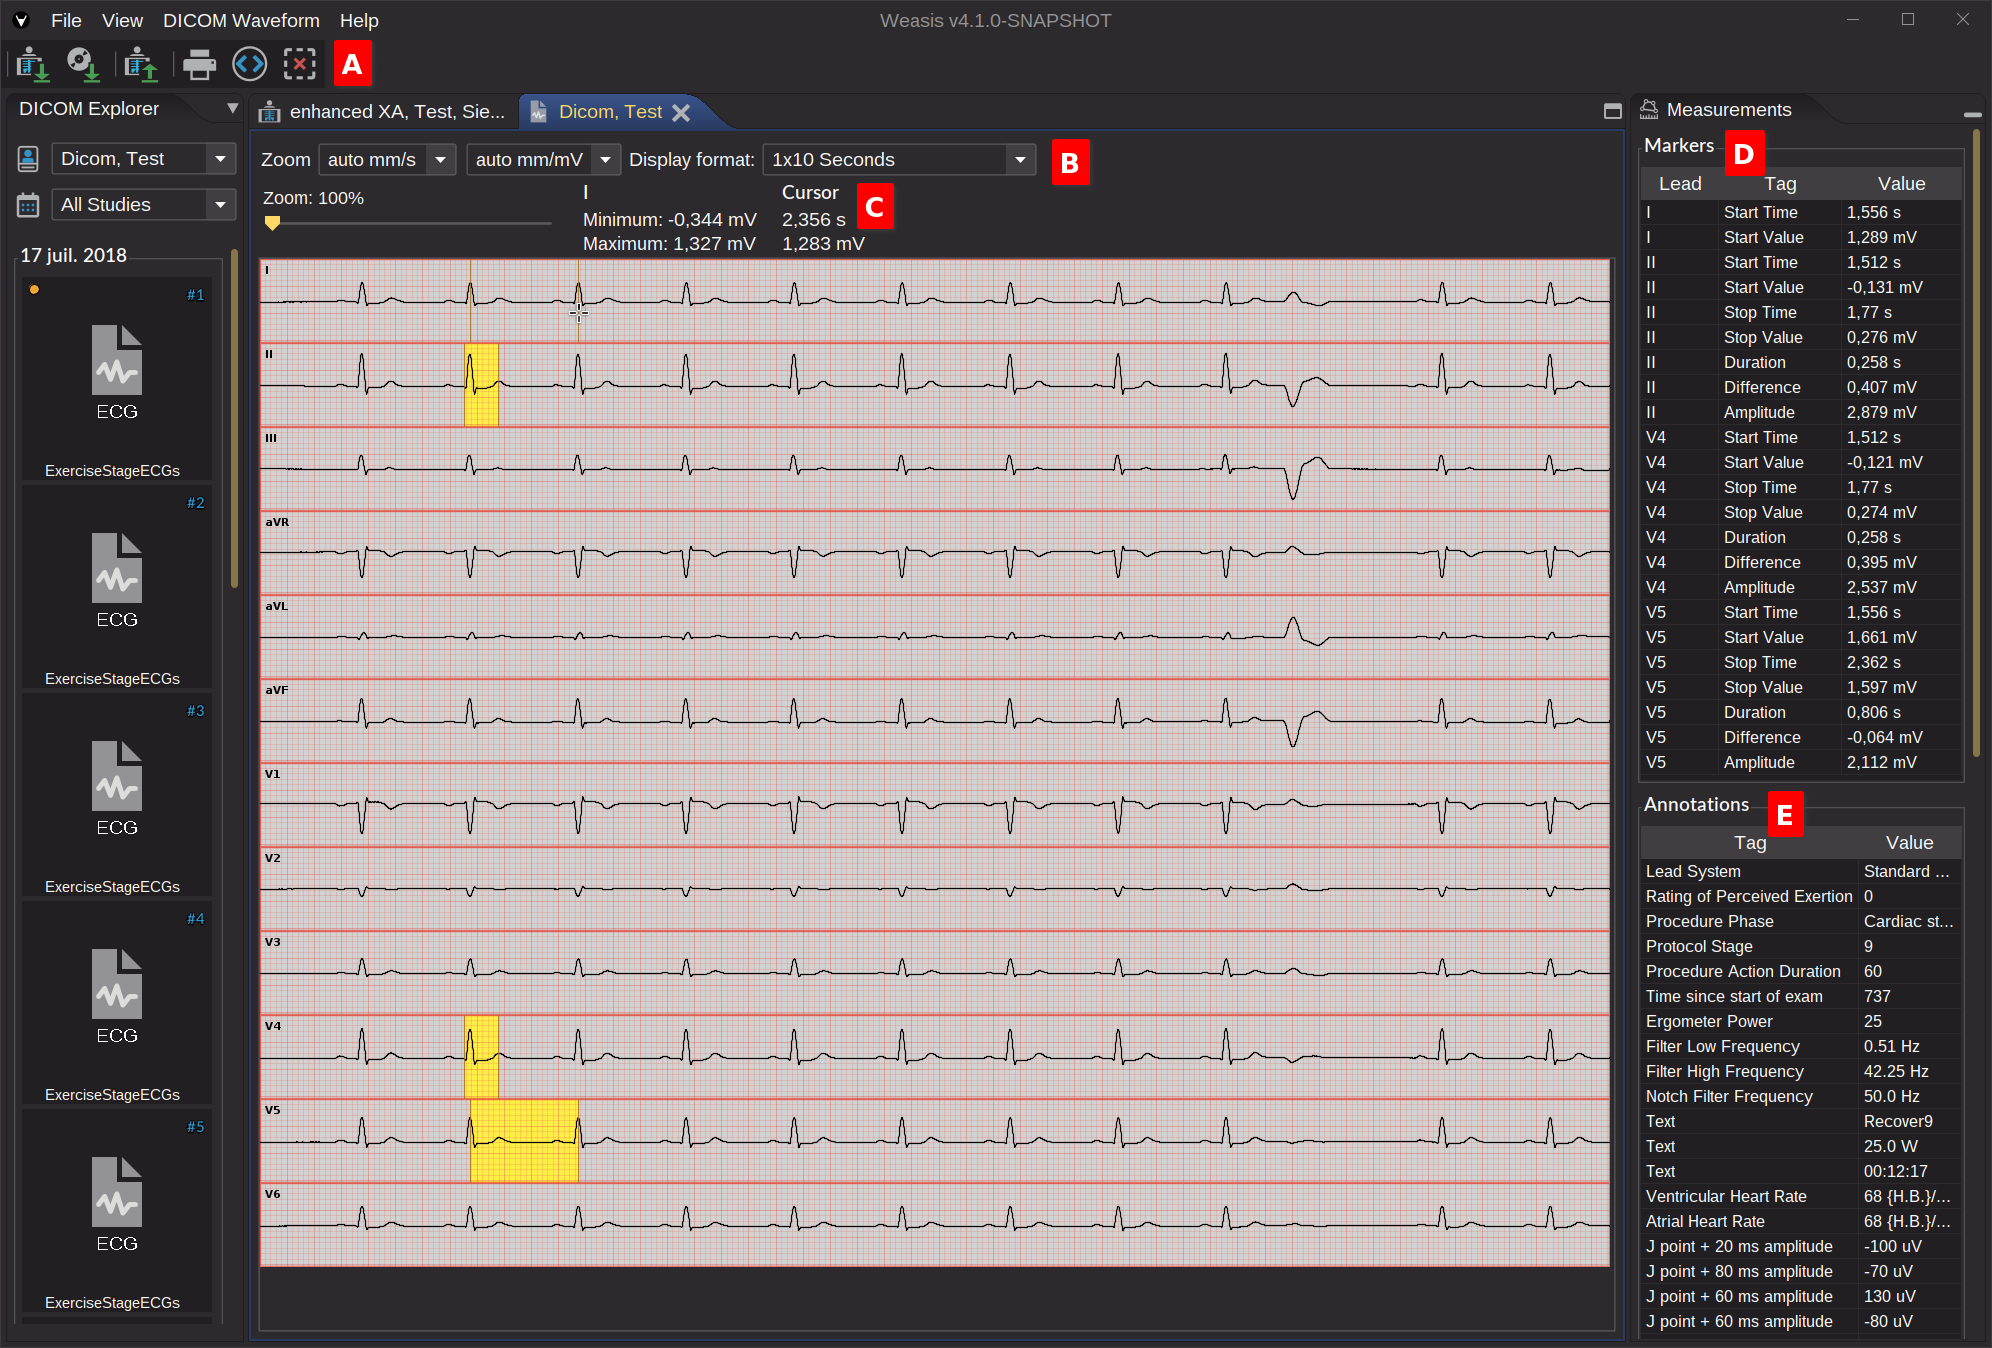
Toolbar A
Actions in the toolbar are:
- Allows you to print the ECG as it is displayed with some basic information (patient/study)
- Show the DICOM metadata of the ECG
- Delete all the measurements (yellow areas in the image above), see Markers
Zoom and Display Format B
The zoom is on several graphic components. The first combo box represents the time, the second represents the voltage, and the slider allows you to zoom in both directions while preserving the aspect ratio.
- Time (X-axis): The number of millimeters per second (by default is “auto mm/s”)
- Voltage (Y-axis): The number of millimeters per milli-volt (by default is “auto mm/mV”)
The Display Format allows you to show the leads in different layouts.
Lead and Cursor information C
Moving the cursor over the ECG displays the following information:
- Lead label: show the minimum and maximum voltage values of a lead
- Cursor: show the current time and voltage values under the cursor
Markers D
The markers are the result of the measurements made on the ECG (yellow areas in the image above). A measurement is done by defining a starting and ending point:
- Start Time: The time in seconds according to the position of the first point
- Start Value: The voltage in milli-volt according to the position of the first point
- Stop Time: The time in seconds according to the position of the second point
- Stop Value: The voltage in milli-volt according to the position of the second point
- Duration: The time elapsed between the 2 points
- Difference: The difference in milli-volt between the start value and the end value
- Amplitude: The maximum variation in milli-volts from the start value to the end value
The actions for making measurements are:
- Action to add a starting point: click
- Action to add an ending point: ctrl+click or right-click
Deleting the measurement in a lead can be done by a middle-click or shift+click. Deleting all bars can be done with the button in the toolbar.
Only one measurement is possible by lead.
Annotations E
The annotations come from 2 groups of DICOM metadata:
- Acquisition context and Annotations: Attributes which describes the conditions present during data acquisition.
- Annotations: may represent a measurement or categorization based on the waveform data, identification of regions of interest or particular features of the waveform, or events during the data collection that may affect diagnostic interpretation (e.g., the time at which the subject coughed).